25 Monitoring Oracle Database Vault
You can monitor Oracle Database Vault by checking for violations to the Database Vault configurations and by tracking changes to policies.
- About Monitoring Oracle Database Vault
You can use the Database Vault home page in Oracle Enterprise Manager Cloud Control to monitor a Database Vault-enabled database. - Monitoring Security Violations and Configuration Changes
A user who has been granted the appropriate role can use Oracle Database Vault Administrator to monitor security violations and configuration changes.
About Monitoring Oracle Database Vault
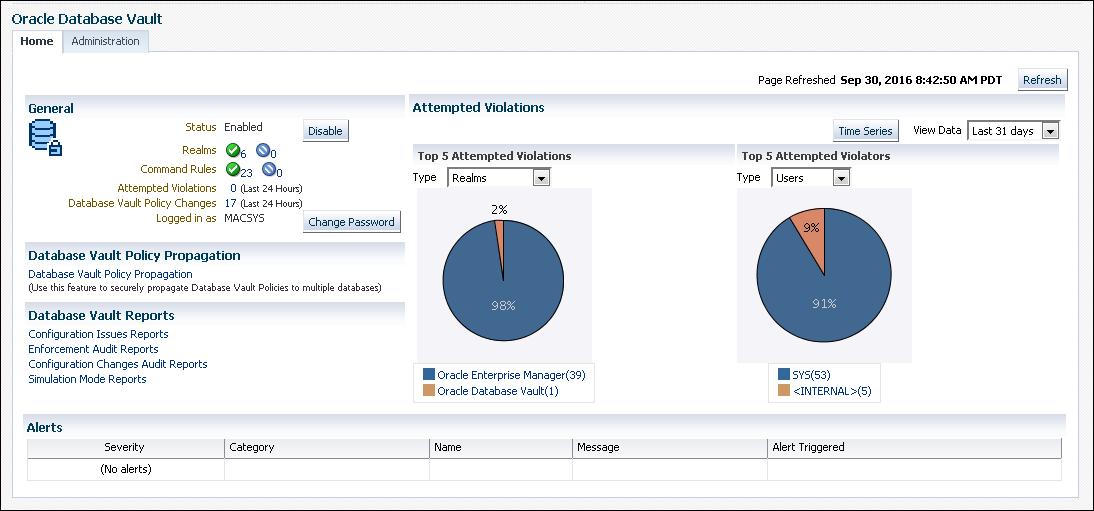
You can use the Database Vault home page in Oracle Enterprise Manager Cloud Control to monitor a Database Vault-enabled database.
This feature displays the top five attempted violations and who the top five attempted violators are. The attempted violations cover violations to realms and to command rules. The attempted violators is categorized into users and client hosts. By clicking the Oracle Database Vault link under Top 5 Attempted Violations, you can find details such as the type of violation, when it occurred, who the user was, and so on. Similarly, if you click the user link (for example, SYS) under Top 5 Attempted Violators, you can find detailed information about each violator, such as the action they performed, the client host name where the action originated, and when the violation occurred. You can manually refresh the data, and restrict the data view, such as within the last 24 hours. This page also shows a table listing all alerts that have been generated.
Before you can view these events, if you have not migrated your database to unified auditing, then you must ensure that the AUDIT_TRAIL initialization parameter is set to DB or DB, EXTENDED. If you have migrated your database to use unified auditing, then you do not need to configure any additional settings. You are ready to check for security violations.
Related Topics
Parent topic: Monitoring Oracle Database Vault
Monitoring Security Violations and Configuration Changes
A user who has been granted the appropriate role can use Oracle Database Vault Administrator to monitor security violations and configuration changes.
Parent topic: Monitoring Oracle Database Vault
