11 Monitoring Oracle Transactional Event Queues and Advanced Queuing
Transactional Event Queues (TEQ) are built for high throughput messaging and streaming of events in transactional applications especially those built with the Oracle Database. TEQ performance monitoring framework uses the GV$ views in the database, and the plumbing of reporting the key metrics of the queues can be integrated with a variety of user interfaces.
This chapter shows how the metrics can be exposed using the popular open source tools – Prometheus and Grafana. These steps can be used to export the metrics to other UIs as well.
This chapter includes the following topics:
Importance of Performance Monitoring
Some of the advantages of having a real-time monitoring framework for a high throughput messaging system are as follows.
-
Know overall messaging system health at a glance and be able to adjust resources up or down with how heavy or light the messaging work load is.
-
Monitor high level key performance indicators: enqueue rates, dequeue rates, queue depth, etc.
-
Find the messaging bottlenecks due to the database load or the system load, by monitoring CPU load, memory utilization, and the database wait class from messaging activity.
-
Check health condition of each queue to quickly identify under-performing ones easily.
-
Access messaging metrics from anywhere, enabling developers to monitor any overheads from applications and able to debug message related issues.
-
Quick response by setting alerts when something goes wrong with the feature in Grafana.
Monitoring Data Flow and UI Framework Setup
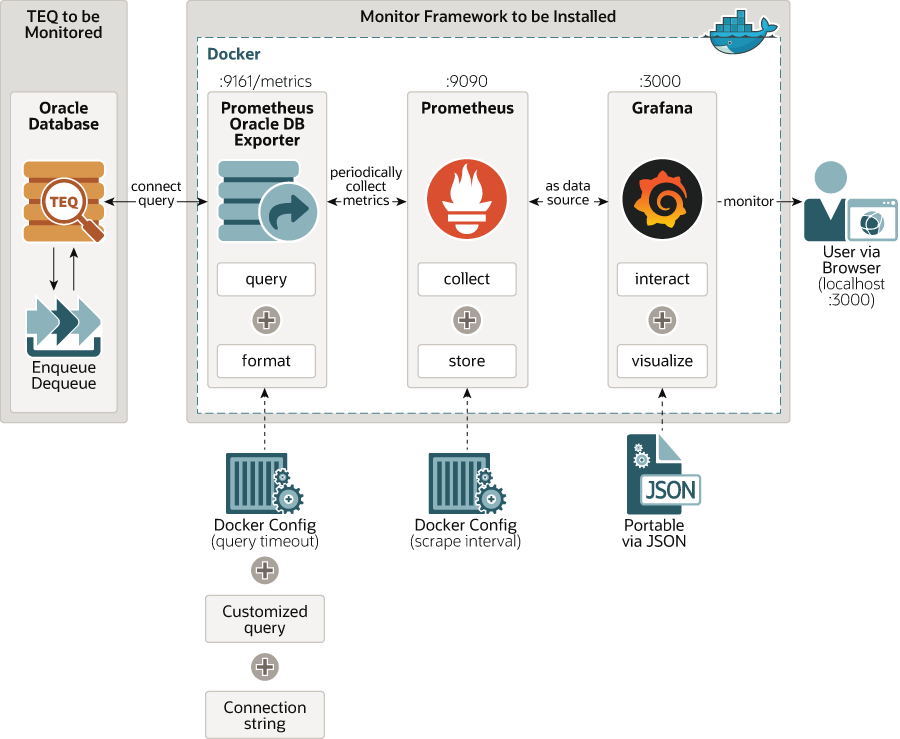
The TEQ monitor system consists of three independent open-source components. A docker container is used to help manage all environments, services, and dependencies on the machine where monitoring framework is installed.
-
Oracle DB Exporter: A Prometheus exporter for Oracle Database, which connects to the database, queries metrics, and formats metrics into Prometheus-like metrics.
-
Prometheus: A monitor system and time-series database, which manages metrics collecting from Oracle DB Exporter in time-series-fashion.
-
Grafana: A analytics and interactive visualization platform, which specifies Prometheus as data source.
TEQ Monitor System consists of three services including Prometheus Oracle DB Exporter, Prometheus, and Grafana. The system is designed to run with Docker, which lets user use the system as a lightweight, portable, self-sufficient container, which can run virtually anywhere. Exporter is the connector to Oracle DB and format the query results to Prometheus-like metrics. Prometheus is a time-series database and periodically controls Exporter to query and collect/store metrics. Grafana uses Prometheus as data source to show the metrics and make it visualized. Grafana is a user-interface with charting and computation built-in. The whole services is configured, managed and handled by Docker-compose.
Figure 11-1 Monitoring Transaction Event Queue
To monitor the TEQ dashboards using Grafans, perform the following steps.
-
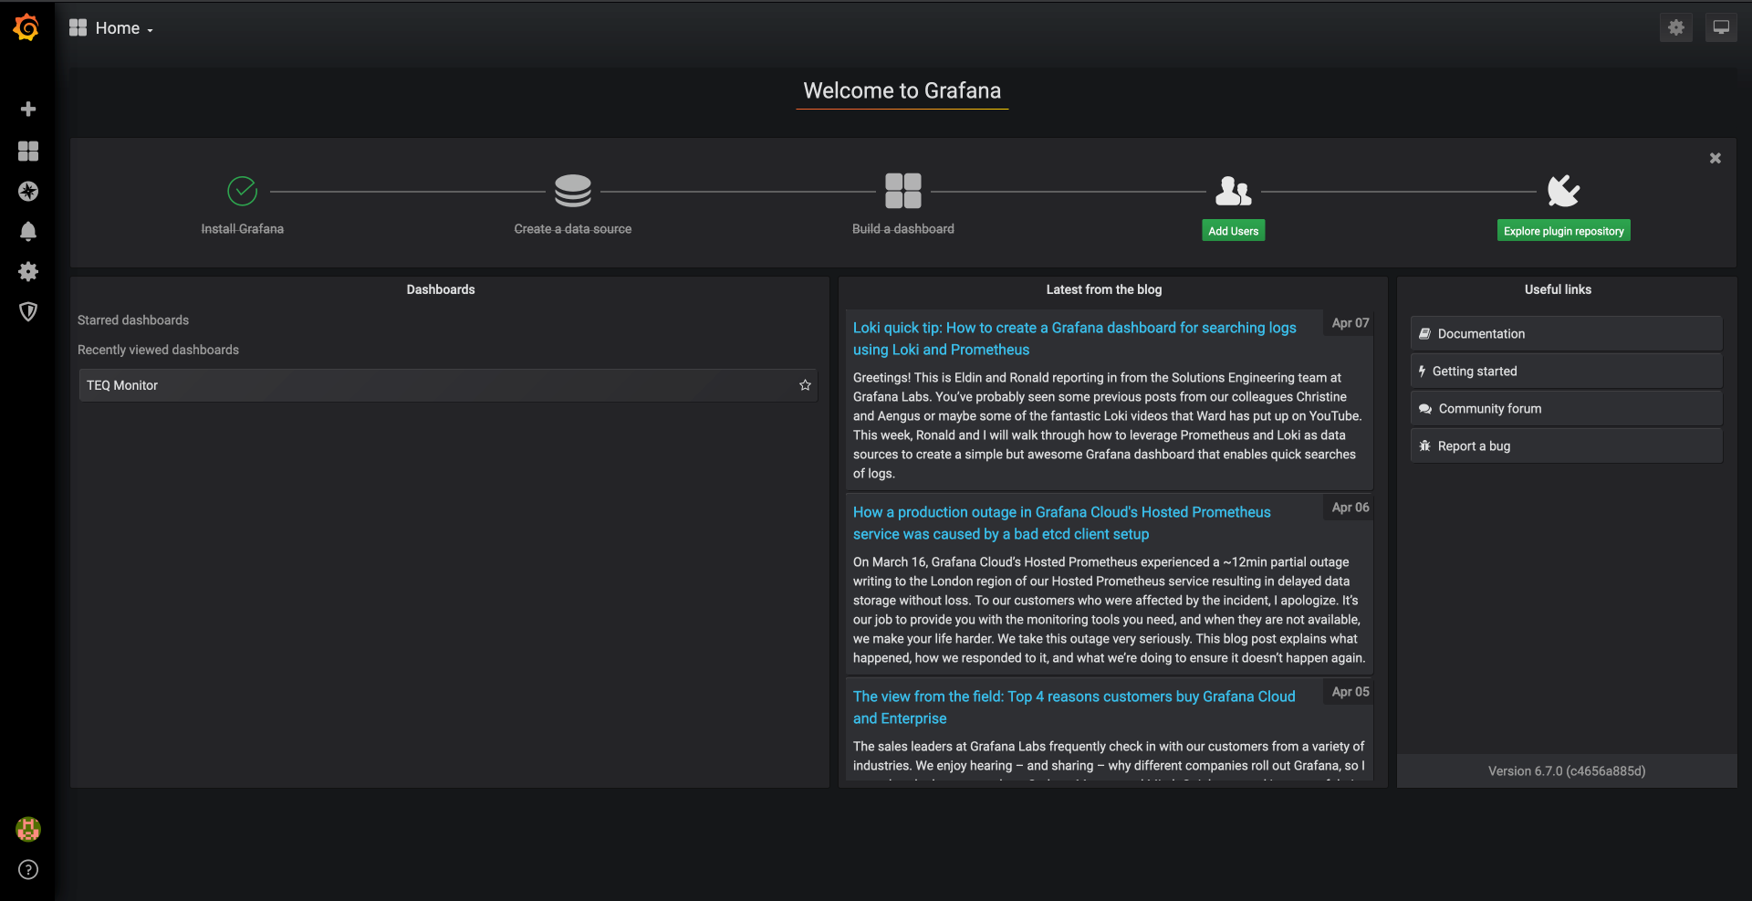
Login to Grafana dashboard using admin user name and password. The Welcome Page is displayed.
Figure 11-2 Welcome Page

-
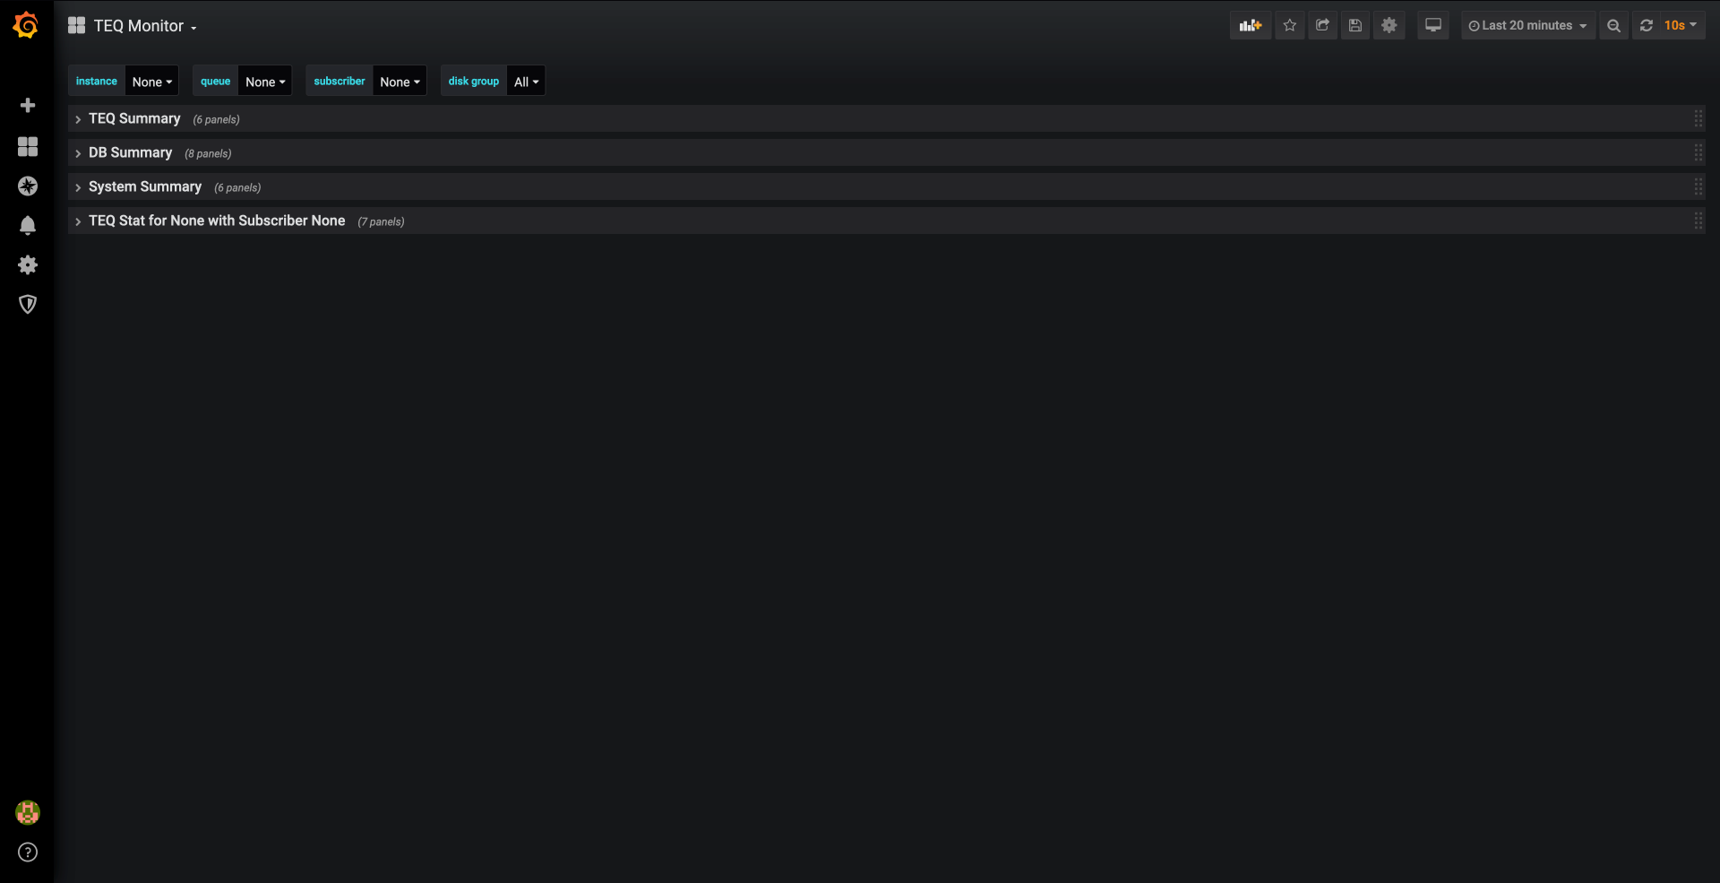
Click TEQ Monitor on the Welcome Page. Once Grafana is setup, the metrics are presented in four selections, and the top level selections are for an instance, queue, subscriber and disk group.
-
Summary across all TEQs
-
Database metrics summary
-
System metrics summary
-
Subscriber summary for each TEQ

-
-
Click on each to view summary.
The following figures shows the dashboards of TEQ Summary, DB Summary, Database Wait Class Latency, and System Summary respectively.
The TEQ Summary dashboard shows overall aggregated TEQ stats including status, number of queues, number of subscribers, enqueue/dequeue rate and number of messages

The Database Summary dashboard shows overall DB performance and stats.
The screen tiles are as follows.
-
Oracle DB Status – Up or Down
-
Active User Sessions – number of user sessions active
-
Active Background sessions – number of background sessions active
-
Inactive user sessions – Number of inactive user sessions
-
Number of processes – Number of database processes
-
ASM Disk Usage – Percent of disk free for each disk volume
-
DB Activity – SQL activity for number of execute counts, parse count total, user commits, user rollbacks.
The database wait class latencies are shown in the DB Wait Class Latency dashboard. Wait class latency is the wait class events latency in milliseconds in the database and can be used to guide overhead analysis through a more detailed AWR report analysis.
The System Summary dashboard shows system level metrics and also the queue level metrics. It reflects the overall performance and status of the system running Oracle DB from CPU utilization and memory used.
System Level Statistics
-
Number of CPUs – Total number of CPUs on the system
-
OS CPU Load - The percentage of CPU capability currently used by all System and User processes
-
CPU Usage: % of CPU busy (for all processes) and % of CPU busy for user processes
-
Total Physical Memory: Total memory on the system, one Instance in case of a RAC
-
Total Free Physical Memory: Total amount of free memory on the instance
-
System Physical Memory free: % of free physical memory
TEQ Queue Level Stats
It displays the statistics of one specific queue, which user can select from the drop-down menu including rate, total messages, queue depth, estimated time to consume and time since last dequeue.
-
Enqueue/Dequeue Messages: Number of messages enqueued; number of messages dequeued
-
Enqueue/Dequeue rate: Number of messages per second that are enqueued and dequeued
-
TEQ Depth – Remaining messages in the queue
-
TEQ Name - Name of the queue
-
Subscriber Name – name of the subscriber
-
Time to drain if no enq – Estimate of time to drain the queue if there are no new enqueues
-
Time since last dequeue – Time elapsed since the last dequeue on the queue
Key Metrics Measured
This section provides a little more detail on the metrics seen in the previous section and how to get these from the Grafana screen. The drop-down menu options are at the level of a: database instance, queue, and a subscriber. AQ/TEQ Summary metrics and Database metrics are for the database instance the user selects in the drop-down menu.
-
AQ/TEQ Summary Metrics
-
TEQ Status: if TEQs are running or not
-
Total Number of TEQs: the number of TEQs running
-
Total TEQ Subscribers: the total number of subscribers for all TEQs
-
Overall Enq/Deq Rates: aggregate enq/deq rates for all TEQs
-
Overall Enqueued Messages: total enqueued messages for the entire queue system
-
Overall Dequeued Messages: total dequeued messages for the entire queue system
-
-
Database Summary Metrics
-
Oracle DB Status: if Oracle DB is running or not.
-
Active User Sessions: the number of active user sessions
-
Active Background Sessions: the number of active background sessions
-
Inactive User Sessions: the number of inactive user sessions
-
Number of Processes: the number of Oracle processes running
-
ASM Disk Usage: Oracle Automatic Storage Management disk group memory usage (e.g. +DATA, +RECO)
-
DB Activity: the number of DB activity occurred including execute count, user commits, parse count total, user rollbacks.
-
DB Wait Class Latency: average latency for DB wait class in ms including administrative, application, commit, concurrency, configuration, idle, network, other, system I/O, user I/O
-
-
System Summary Metrics
-
Number of CPUs: the number of CPU of the system running Oracle DB
-
OS CPU Load: current number of processes that are either running or in the ready state, waiting to be selected by the operating-system scheduler to run. On many platforms, this statistic reflects the average load over the past minute
-
CPU Usage (Busy + User): the CPU usage in percentage in real time including CPU in busy state or CPU in executing user code.
-
Total Physical Memory: total physical memory of the system.
-
Total Free Physical Memory: total free physical memory of the system.
-
System Free Physical Memory: the percentage of free memory in the system.
-
-
Queue Level Metrics
-
Enq/Deq Messages: total messages enqueued/dequeued to/from the TEQ
-
Enq/Deq Rate: enq/deq rate for the TEQ
-
TEQ Depth: total messages remained in the queue.
-
TEQ Name: the name of TEQ
-
Subscriber Name: the name of TEQ subscriber
-
Time to Drain if No Enq: total amount of time to consume all messages if there is no enq
-
Time since Last Deq: time difference between current time and the time since the last deq operation
-
Scripts for Setting up Monitoring
The steps followed to set up the monitoring framework are provided below.
-
Copy/Clone the Package: get the whole package which consists of following files/directories:
-
Makefile -
docker-compose.yml -
.env -
README.md -
Database metrics exporter
-
Prometheus
-
Grafana
-
-
Install Docker: docker will be used here for manage environments/services/dependencies https://docs.docker.com/install/
-
Provide Oracle DB Connection String: place connection string in
.envfile.Note:
Grant monitoring user with sufficient privileges (select system views).
-
Start Monitor: at the root folder of the monitor package, type in terminal
make run. Before doing that, make sure Oracle DB and TEQ is running. After monitoring, go tohttp://localhost:3000 -
Stop/Remove Monitor: type in terminal
make stop -
More Usages:
-
make logs: shows logs of all services -
make pause: pauses query/sampling/monitor -
make unpause: resumes all services
-
Once these steps are done the basic services are set up. Configuration and customization are also available from many perspectives (e.g. service port, monitor interval, extra metrics, change dashboard, see below for more information)
Configuration/Customization of TEQ Monitor
-
Configurations
-
Change Service Port: specify your own local ports in
docker-compose.yml. If you modify exporter port, please also modifyconfig.ymlunder/prometheusfor correct target. -
Change Monitor Interval: specify Prometheus/Exporter scrape interval/timeout/evaluation in
config.ymlunder/prometheusto adjust monitoring sampling parameters.
-
-
Customization
-
Add Metrics: customize your own metrics in default-metrics.toml under exporter folder. See
iamseth/oracledb_exportergithub for more guidance and info. -
Customize Dashboard: add panel and query metrics from Prometheus. See instruction of Grafana for more guidance and info.
-
Measuring Kafka Java Client and Kafka Interoperability with TEQ
This framework used to measure TEQ will also work when using the Kafka Java client with TEQ, or when Kafka interoperates with TEQ using the JMS source and sink connectors. The queue level metrics, the database level metrics, and the system level metrics are all the same.
See Interoperability of Transactional Event Queue with Apache Kafka for more information.
Troubleshooting
See docker-compose doc for more guidance and info. https://docs.docker.com/compose/reference/logs/


