11 Identifying High-Load SQL Statements
High-load SQL statements may consume a disproportionate amount of system resources. These SQL statements often greatly affect database performance and must be tuned to optimize their performance and resource consumption. Even when a database is properly tuned, inefficient SQL can significantly degrade performance.
Identifying high-load SQL statements is an important SQL tuning activity that must be performed regularly. Automatic Database Diagnostic Monitor (ADDM) automates this task by proactively identifying potential high-load SQL statements. Additionally, you can use Oracle Enterprise Manager Cloud Control (Cloud Control) to identify high-load SQL statements that require further investigation. After you have identified the high-load SQL statements, you can tune them with SQL Tuning Advisor and SQL Access Advisor.
This chapter describes how to identify high-load SQL statements and contains the following sections:
Identification of High-Load SQL Statements Using ADDM Findings
By default, ADDM runs proactively once every hour. It analyzes key statistics gathered by the Automatic Workload Repository (AWR) over the last hour to identify any performance problems, including high-load SQL statements. When the system finds performance problems, it displays them as ADDM findings in the Automatic Database Diagnostic Monitor (ADDM) page.
ADDM provides recommendations with each ADDM finding. When a high-load SQL statement is identified, ADDM gives recommendations, such as running SQL Tuning Advisor on the SQL statement. You can begin tuning SQL statements as described in Tuning SQL Statements .
Identifying High-Load SQL Statements Using Top SQL
ADDM automatically identifies high-load SQL statements that may be causing system-wide performance degradation. Under normal circumstances, manual identification of high-load SQL statements is not necessary. In some cases, however, you may want to monitor SQL statements at a more granular level.
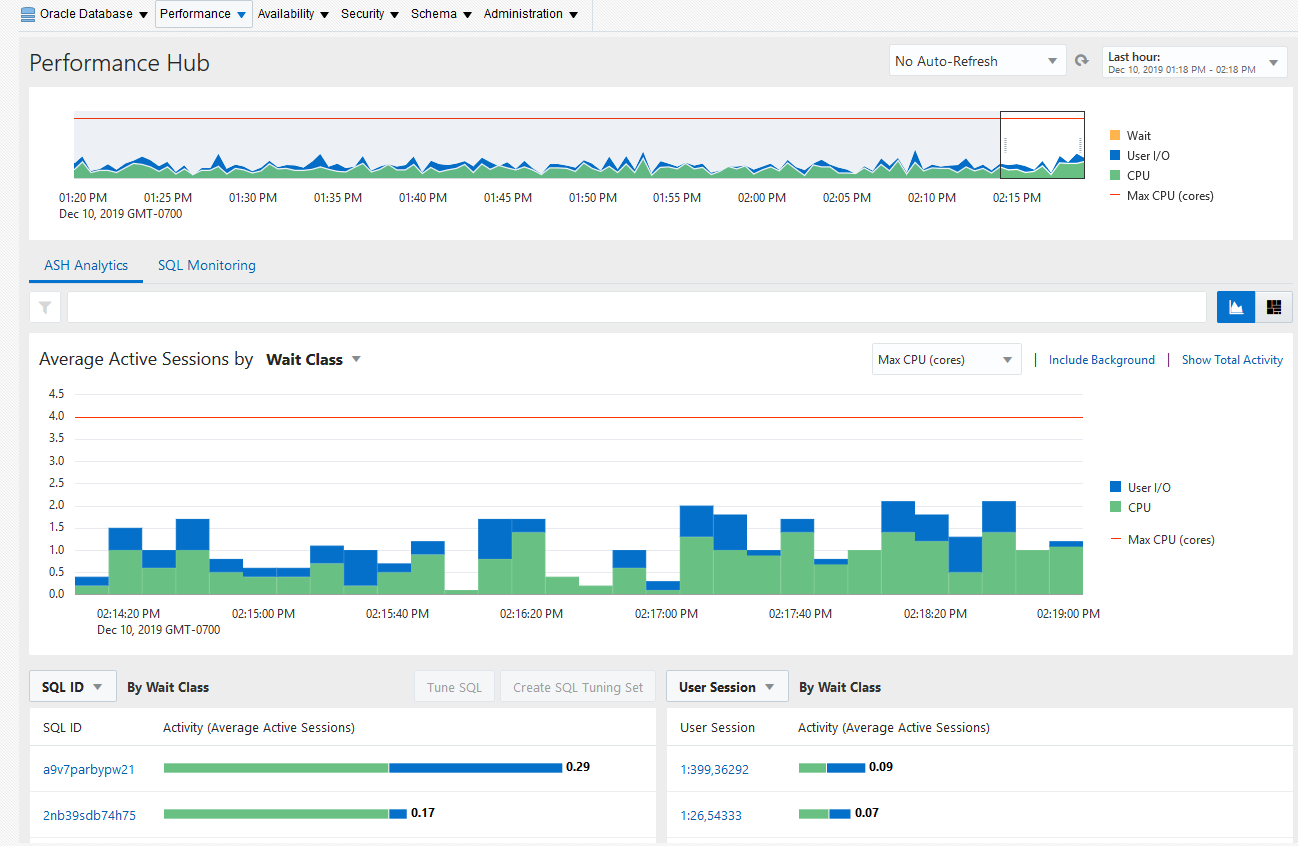
The Top SQL section of the Top Activity page in Cloud Control enables you to identify high-load SQL statements for any 5-minute interval.
Figure 11-1 shows an example of the Top Activity page. The page shows a 1-hour time line of the top activity running on the database. SQL statements that are using the highest percentage of database activity are listed under the Top SQL section, and are displayed in 5-minute intervals.
To access the SQL Monitoring:
-
From the Targets drop-down menu, select Databases.
See "Accessing the Database Home Page" for more information.
-
From the Performance drop-down menu, select Performance Hub and ASH Analytics.
-
Using the drop-down menu on the right of Average Active Sessions by, select SQL and one of its fly-out options.
- SQL ID
- Top Level SQL ID
- SQL Force Matching Signature
- SQL Plan Hash Value
- SQL Full Plan Hash Value
- SQL Plan Operation
- SQL Plan Operation Line
- SQL Opcode
- Top Level SQL Opcode
-
To move the 5-minute interval, drag the shaded box to the desired time.
The information contained in the Top SQL section is automatically updated to reflect the selected time period.
