Run a Notebook with Python Interpreter

To run Python commands in a notebook, you must first connect to the Python interpreter. To use OML4Py, you must import the oml module.

In an Oracle Machine Learning notebook, you can add multiple paragraphs, and each paragraph can be connected to different interpreters such as SQL or Python. This example shows you how to:
  • Connect to a Python interpreter to run Python commands in a notebook
  • Import the Python modules - oml, matplotlib, and numpy
  • Check if the oml module is connected to the Oracle Database

Note:

z is a reserved keyword and must not be used as a variable in %python paragraphs in Oracle Machine Learning Notebooks.
Assumption: The example assumes that you have created a new notebook named Py Note.
  1. Open the Py Note notebook and click the interpreter bindings icon. View the available interpreter bindings.
  2. To connect to the Python interpreter, type %python
    You are now ready to run Python scripts in your notebook.
  3. To use OML4Py module, you must import the oml module. Type the following Python command to import the oml module, and the click run icon. Alternatively, you can press Shift+Enter keys to run the notebook.
    import oml
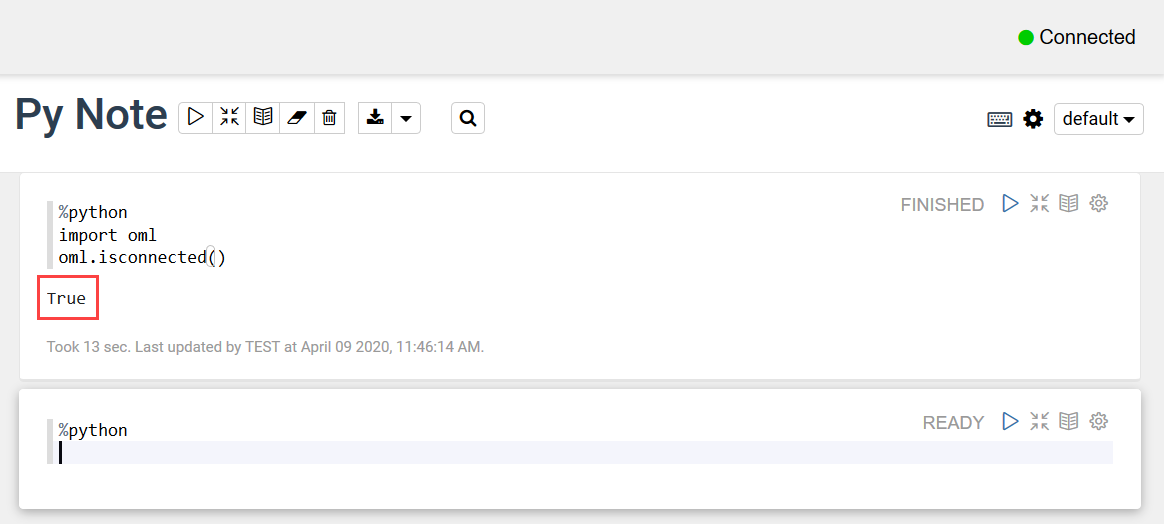
  4. To verify if the oml module is connected to the Database, type:
    oml.isconnected()
    Once your notebook is connected, the command returns TRUE. The notebook is now connected to the Python interpreter, and you are ready to run python commands in your notebook.

Example to demonstrate the use of the Python modules - matplotlib and numpy , and use random data to plot two histograms.

  1. Type the following commands to import the modules:
    %python
    import matplotlib.pyplot as plt
    import numpy as np
    • Matplotlib - Python module to render graphs
    • Numpy - Python module for computations
  2. Type the following commands to compute and render the data in two histograms.
    
    list1 = np.random.rand(10)*2.1
    list2 = np.random.rand(10)*3.0
    
    plt.subplot(1,2,1) # 1 line, 2 rows, index nr 1 (first position in the subplot)
    plt.hist(list1)
    plt.subplot(1, 2, 2) # 1 line, 2 rows, index nr 2 (second position in the subplot)
    plt.hist(list2)
    plt.show()
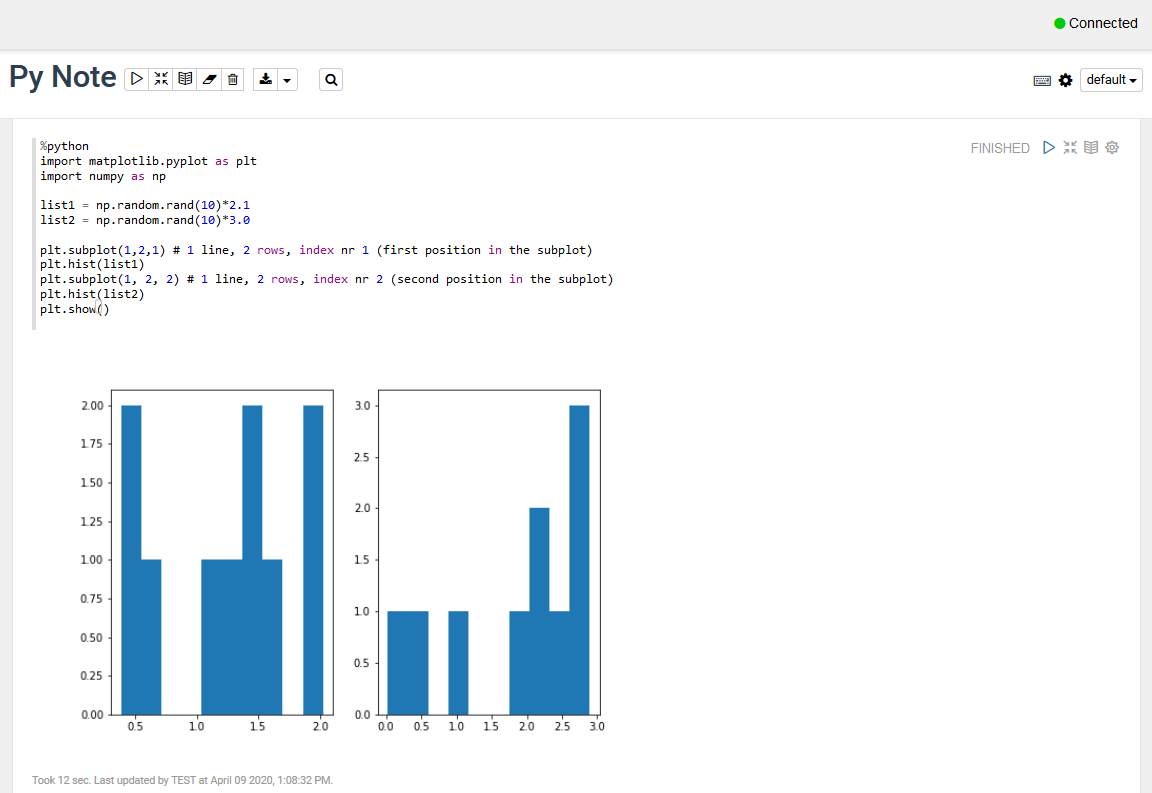
    In this example, the commands import two Python module to compute and render the data in two histograms list1 and list2.
  3. Click Run.
    The output section of the paragraph which contains a charting component displays the results in two histograms - list1 and list2, as shown in the screenshot.