10 Monitoring and Tuning the Database
Monitoring the performance of a database and ensuring that it performs optimally is an important task for a database administrator. This chapter discusses the features and functions included in Oracle Database that make it easy to monitor database health, identify performance problems, and implement any corrective actions.
This chapter contains the following topics:
10.1 Proactive Database Monitoring
This section discusses the following topics:
10.1.1 Monitoring General Database State and Workload
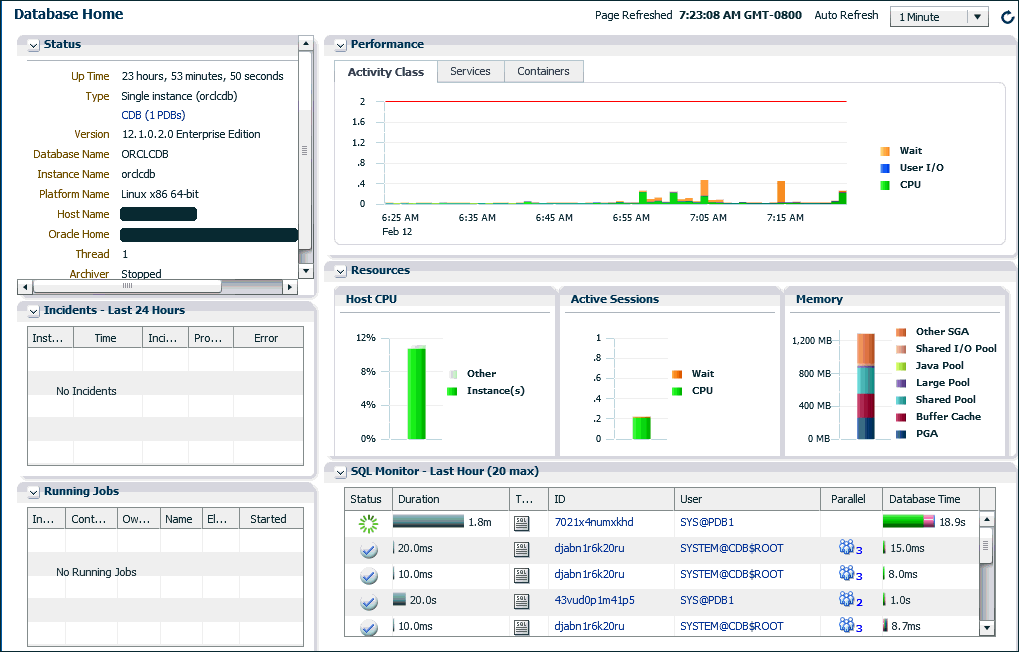
The Database Home page enables you to monitor the state and workload of your database. It provides a central place for general database state information and is updated periodically.
To monitor the general database state and workload:
10.1.2 Monitoring Performance Using the Performance Hub
The Performance Hub allows you to view all the performance data available for a specified time period. Once a time period is selected, the performance information is collected and presented based on performance subject areas.
This section includes the following topic:
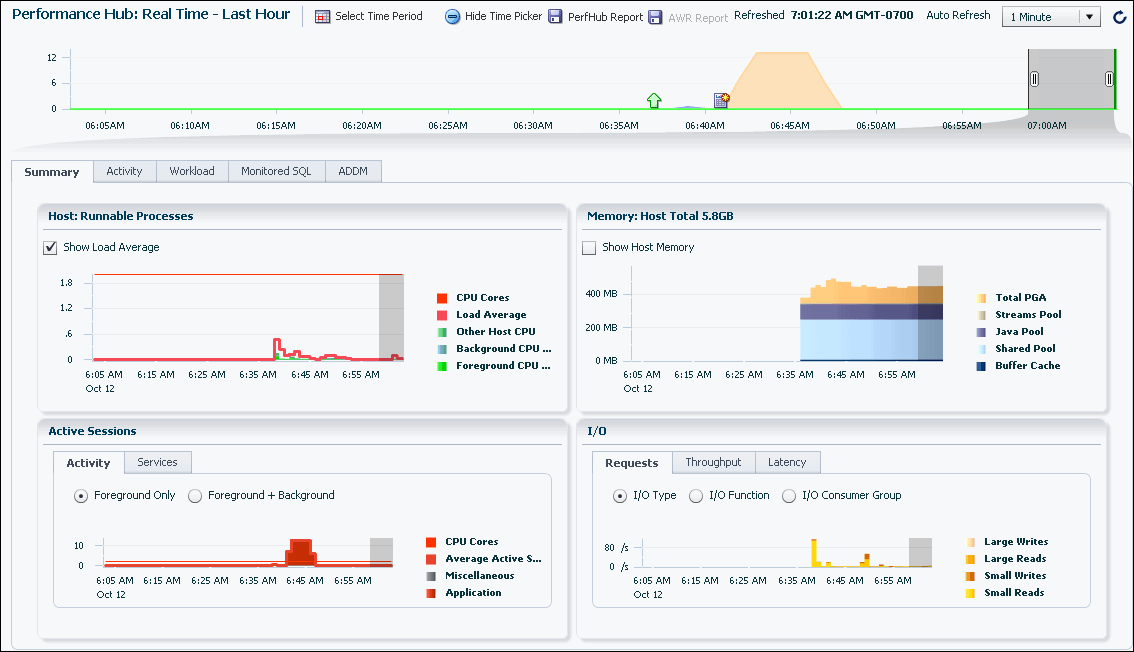
When real-time data is selected, more granular data is presented (because data points are available every minute).
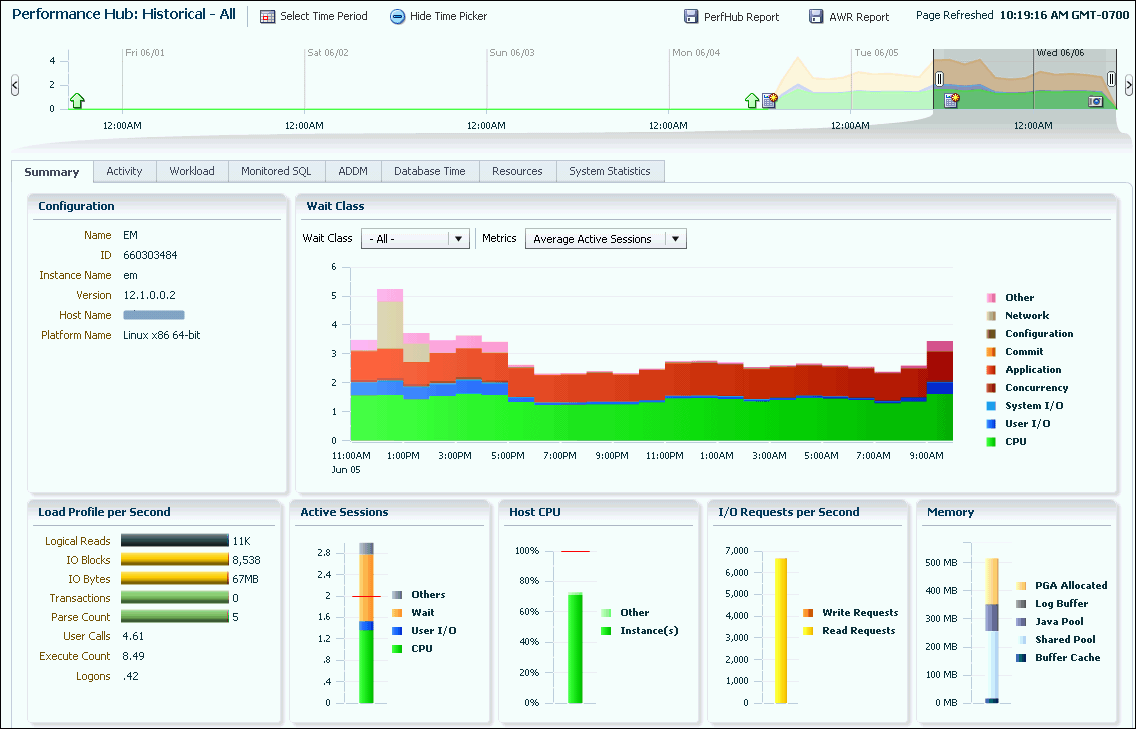
When historical data is selected, more detailed data (broken down by different metrics) is presented, but the data points are averaged out to the Automatic Workload Repository (AWR) interval (usually an hour).
Different tabs are available in the Performance Hub, depending on whether real-time or historical data is selected for the time period.
The following table describes the Performance Hub tabs, and indicates whether the tab is available when real-time data is selected or historical data is selected, or both.
| Performance Hub Tab Name | Description | Available When |
|---|---|---|
|
Summary |
The Summary tab provides an overall view of the performance of the system for the specified time period. When real-time data for the last hour is displayed in the Performance Hub page, this tab shows a summary of running processes, memory allocation, database activity by category, and I/O data during the last hour. When historical data is displayed in the Performance Hub page, this tab shows a summary of average active session waits by category, load profile per second, active session activity, host CPU usage by the database instance and other processes, I/O read and write requests per second, and memory usage during the selected time period. |
Real-time data or historical data is selected in the Select Time Period field for a non-CDB, CDB, or PDB |
|
RAC |
The RAC tab appears only when EM Express is being used with an Oracle RAC database (or cluster database). When real-time data is selected, this tab shows global cache activity information and a breakdown of activity (average active sessions) and resource usage (CPU, I/O, memory) per instance. When historical data is selected, this tab shows global cache activity information and a breakdown of activity (average active sessions) and resource usage (CPU, I/O, memory) per instance during the selected time period. |
Real-time data or historical data is selected in the Select Time Period field |
|
Activity |
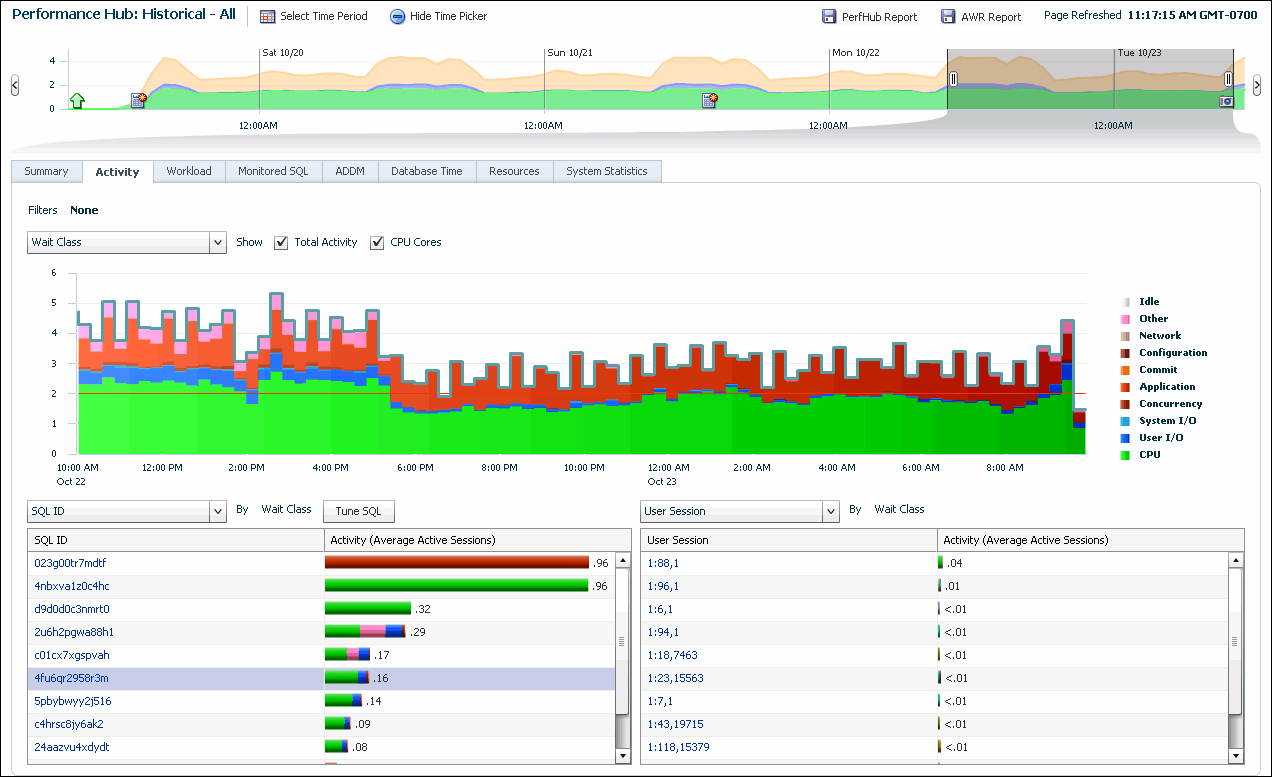
The Activity tab shows Active Session History (ASH) analytics. It allows detailed drilldown into average active sessions for ASH over the selected time period. This tab enables you to select an average active sessions dimension and view the top activity for that dimension for a selected time period. For example, you can view the SQL statements and user sessions that had the top average active sessions activity for the selected time period. |
Real-time data or historical data is selected in the Select Time Period field for a non-CDB, CDB, or PDB |
|
Workload |
The workload profile charts show the pattern of user calls, parse calls, Redo Size and SQL*Net over the last 60 minutes in real-time mode. The Sessions chart show the logon rate, current logons and open cursors. Clicking a SQL_ID displays the SQL Details page with more information about that SQL statement. |
Real-time data or historical data is selected in the Select Time Period field for a non-CDB, CDB, or PDB |
|
Monitored SQL |
This tab enables you to view information about monitored SQL statements that were executing or that completed during the selected time period. The table displays information about monitored SQL statement executions. If there is a green spinning icon in the Status column, then the monitored statement did not complete during the selected time period. A red cross indicates that the SQL did not complete either due to an error or due to the session getting terminated. If there is a check mark in the Status column, then the statement completed its execution during the selected time period. SQL statements are monitored only if they have consumed at least 5 seconds of CPU or I/O time. You can view information such as the status of a statement, its duration, its type (SQL, PL/SQL, or DBOP), its SQL ID, its SQL plan hash, the user who issued it, whether it executed as a serial or parallel statement, the time the database spent performing CPU activity, I/O, or other activity for the statement, the read and write requests and bytes associated with the statement, and the start and end time for the statement. Click a SQL ID to display the SQL Details page with more information about that SQL statement. |
Real-time data or historical data is selected in the Select Time Period field for a non-CDB, CDB, or PDB |
|
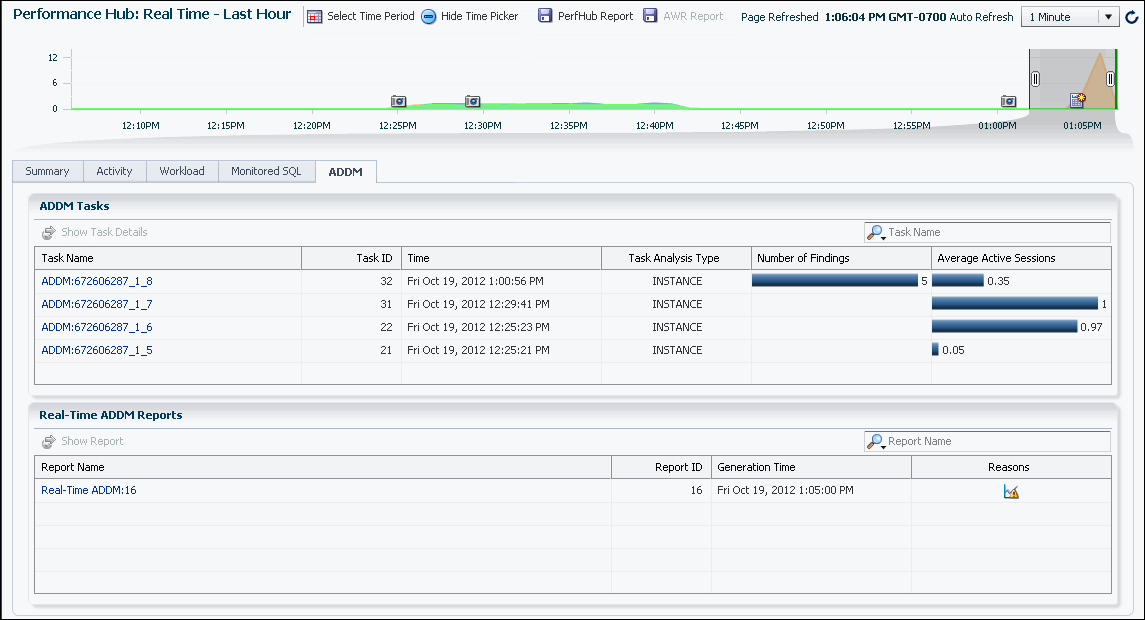
ADDM |
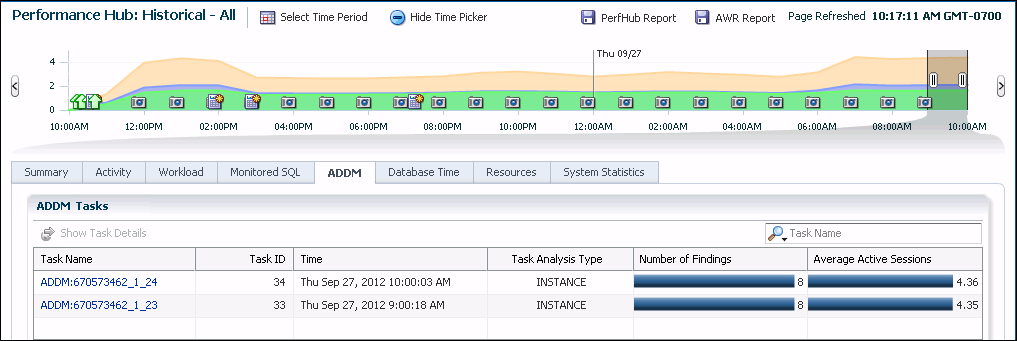
The ADDM tab enables you to view performance findings and recommendations that have been found by Automatic Database Diagnostics Monitor (ADDM) for tasks performed in the database during the selected time period. See "Performance Self-Diagnostics: Automatic Database Diagnostic Monitor" for more information about ADDM features. |
Real-time data or historical data is selected in the Select Time Period field for a non-CDB or CDB. This tab is available for a PDB only when a CDB administrator logs into a CDB and navigates (drills down) to the PDB. The tab is not available when a PDB administrator is logged directly into the PDB. |
|
Database Time |
The Database Time tab enables you to view wait events by category for various metrics, and to view time statistics for various metrics for the selected time period. |
Historical data is selected in the Select Time Period field for a non-CDB, CDB, or PDB. |
|
Resources |
The Resources tab enables you to view operating system resource usage statistics, I/O resource usage statistics, and memory usage statistics for the selected time period. |
Historical data is selected in the Select Time Period field for a non-CDB, CDB, or PDB. |
|
System Statistics |
The System Statistics tab enables you to view database statistics by value, per transaction, or per second for the selected time period. |
Historical data is selected in the Select Time Period field for a non-CDB, CDB, or PDB. |
|
Containers |
The Containers tab enables you to view open time, active sessions, memory used, I/O requests, and I/O throughput information for the PDBs in the CDB. |
Real-time data or historical data is selected in the Select Time Period field for a CDB. |
The following figure shows the Performance Hub when Real Time - Last Hour data is selected.
The following figure shows the Performance Hub when historical data is selected.
To view Performance Hub data:
10.1.2.1 Specifying the Time Period for Which to Display Statistics
In the Real-Time: Last Hour mode, the data in the Performance Hub is sourced from Active Session History (ASH). The ASH data is written to disk when the ASH buffer is filled up or after 1 hour, and is stored as part of the AWR framework.
By default, AWR has a retention period of 8 days. When you view historical data in the Performance Hub, you are viewing statistics collected as part of the hourly snapshots in AWR.
You use the Select Time Period field in the Performance Hub to determine the time periods for which statistics are available for viewing. Because Oracle Database statistics are stored in memory for one hour, the Real Time - Last Hour option always appears in the Select Time Period list.
The historical data options that are available in the Select Time Period list change, depending on the time period for which data is available in AWR, as shown in the following table:
| Time Period for Which AWR Data is Available | Historical Options in the Select Time Period List |
|---|---|
|
Less than 24 hours |
Historical - AllFoot 1 |
|
More than 24 hours, but less than 7 days |
Historical - Day Historical - AllFoot 1 Historical - Custom |
|
7 days |
Historical - Day Historical - Week Historical - Custom |
|
8 days or moreFoot 2 |
Historical - Day Historical - Week Historical - Custom |
Footnote 1
This option is available only when less than one day's data or less than one week's data is available in AWR. Database statistics that are stored in memory are flushed to AWR after one hour.
Footnote 2
The default AWR retention period is 8 days, so you must change the default AWR retention period to store more than a week of data in AWR
After you choose a historical option from the Select Time Period field, you use the time picker to specify the time period for which data is displayed in the Performance Hub tabs.
The following table describes the data displayed and available for selection in the time picker when different values are selected in the Select Time Period field for the Performance Hub:
| Selected Time Period | Time Picker | Description |
|---|---|---|
|
Real Time - Last Hour |
Displays statistics for the past hour from memory |
Data is displayed in 5 minute blocks in the time picker. Use the time picker to select from 1 minute to 60 minutes of data to display in the Performance Hub. |
|
Historical - Day |
Displays statistics from an hour up to 24 hours from AWR |
Data is displayed in 1 hour blocks in the time picker. Use the time picker to select from 1 hour to 24 hours of data to display in the Performance Hub. |
|
Historical - All |
Displays statistics for the length of time for which AWR statistics exist |
Appears only when less than one day's data or less than one week's data is available in AWR. The Historical - All option is available only when there is not enough AWR data to provide the Historical - Day option or the Historical - Week option. |
|
Historical - Week |
Displays statistics from a day up to 7 days from AWR |
Data is displayed in 1-day blocks in the time picker. Use the time picker to select from 1 day to 7 days of data to display in the Performance Hub. When Historical - Week is selected, the current week of AWR data appears in the time picker by default. To view AWR data from the previous week in the time picker, use the < button in the time picker. |
|
Historical - Custom |
Displays AWR statistics for the length of time you select in the Select Time Period dialog box after choosing the Historical - Custom option |
Use the time picker to select the time period for which you want to display statistics in the Performance Hub. |
See Also:
-
Oracle Database Concepts for more information about ASH
-
Oracle Database Performance Tuning Guide for more information about changing the default AWR retention period
10.1.3 About Viewing Performance Statistics on a Standby Database
You can view performance statistics for a standby database in an Oracle Active Data Guard environment using the EM Express Performance Hub.
When you use EM Express to view a standby database in an Oracle Active Data Guard environment, the top left section of the EM Express menu bar displays the name of the standby database, the release number for the database, and the string “standby.” For example, the following figure shows the menu bar for a standby database named ADG for Oracle Database 12c Release 2 (12.2.0.1.0):
Description of the illustration standby_db.png
The Oracle Active Data Guard redo apply mechanism applies real-time and historical data from the primary database to the standby database. However, because it is unlikely that you would want to view historical performance data from the primary database in the Performance Hub on the standby database, historical data for a standby database cannot be selected in the Performance Hub. The Select Time Period button in the Performance Hub is unavailable for a standby database, which means that only real-time data for the standby database can be viewed in the Performance Hub.
Note:
You must have a license for the Oracle Active Data Guard option to be able to view performance statistics on a standby database.
10.1.4 Performance Self-Diagnostics: Automatic Database Diagnostic Monitor
Oracle Database includes a self-diagnostic engine called Automatic Database Diagnostic Monitor (ADDM). ADDM makes it possible for Oracle Database to diagnose its own performance and determine how identified problems can be resolved.
To facilitate automatic performance diagnosis using ADDM, Oracle Database periodically collects snapshots of the database state and workload. Snapshots are sets of historical data for specific time periods that are used for performance comparisons by ADDM. Snapshots provide a statistical summary of the state of the system at a point in time. These snapshots are stored in Automatic Workload Repository (AWR), residing in the SYSAUX tablespace. The snapshots are stored in this repository for a set time (8 days by default) before they are purged to make room for new snapshots.
ADDM analyzes data to determine the major problems in the system, and may recommend solutions and quantify expected benefits. ADDM analysis results are represented as a set of findings.
EM Express provides two types of ADDM findings.
ADDM
ADDM performs its analysis on data that has been captured and stored in AWR. For ADDM, the default collection interval for a snapshot is one hour.
Generally, ADDM is used for identifying systemwide systemic problems. It calls attention to performance problems that include:
-
Resource contention (bottlenecks), such as when your database is using large amounts of CPU time or memory due to high load SQL statements
-
Poor connection management, such as when your application is making too many logins to the database
-
Lock contention in a multiuser environment, such as when one user process acquires a lock to safely update data in a table, causing other user processes that must acquire locks against the same table to wait, resulting in a slower database performance
Real-Time ADDM
Real-Time ADDM automatically monitors the database in real time.
Real-Time ADDM proactively detects and diagnoses transient high impact problems such as these before they threaten application performance:
-
High CPU
-
I/O spikes
-
Memory
-
Interconnect issues
-
Hangs and deadlocks
When Real-Time ADDM detects a possible performance problem, it triggers data collection. The data is saved in the report repository (part of AWR). When you view a Real-Time ADDM report from EM Express, an analysis is performed, and findings and recommendations are made. Because Real-Time ADDM reports are stored in AWR, they can help you identify recurrences of a problem over time.
Table 10-1 provides a summary of the ADDM features available in EM Express.
Table 10-1 ADDM Features in EM Express
| Feature | New? | Description | Analysis Period | To View Analysis Findings |
|---|---|---|---|---|
|
ADDM |
No |
This is the traditional ADDM that has existed in previous database releases. ADDM Tasks are presented on the ADDM tab in the Performance Hub. |
The AWR interval, which is 1 hour, by default |
In the ADDM Tasks table on the ADDM tab, click a Task Name. |
|
Real-Time ADDM |
Yes |
Proactively detects and diagnoses transient high impact problems in real time. Real-Time ADDM Reports are presented on the ADDM tab in the Performance Hub. |
Real time |
In the Real-Time ADDM Reports table on the ADDM tab, select a report and click View Performance Report. |
See Also:
-
Oracle Database 2 Day + Performance Tuning Guide for more information about automatic database performance monitoring
10.2 Diagnosing Performance Problems Using ADDM
At times, database performance problems arise that require your diagnosis and correction. Usually, these problems are brought to your attention by ADDM, which analyzes data for different time periods.
This section contains the following topics:
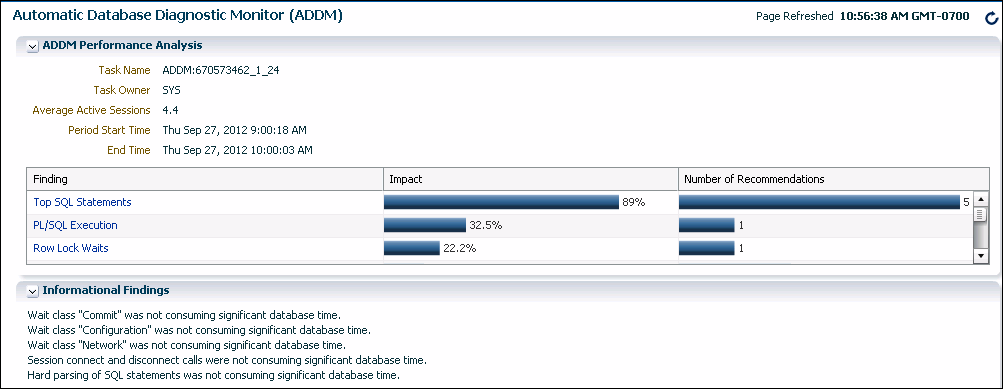
10.2.1 Viewing a Summary of ADDM Performance Findings
ADDM analysis results consist of a description of each finding and a recommended action. You can view a summary of findings and their impacts on the system.
To view a summary of ADDM performance findings:
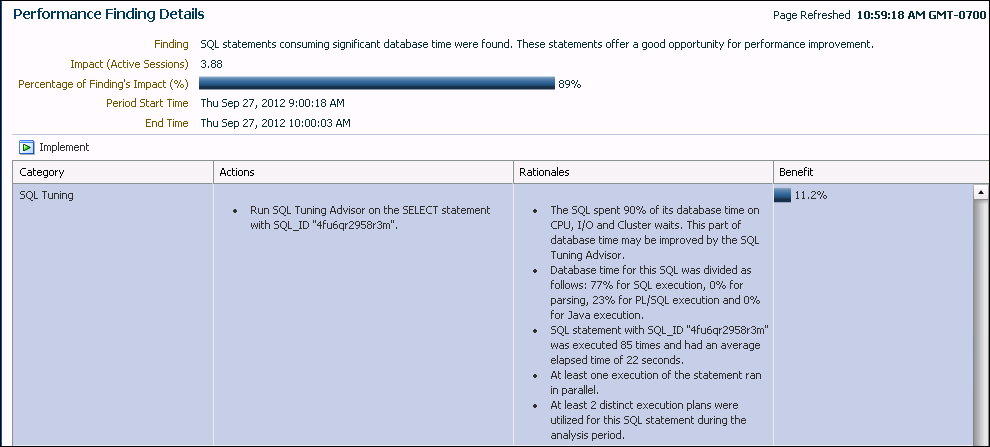
10.2.2 Responding to ADDM Performance Findings
You can act upon the recommendations that accompany ADDM performance findings.
To respond to ADDM performance findings:
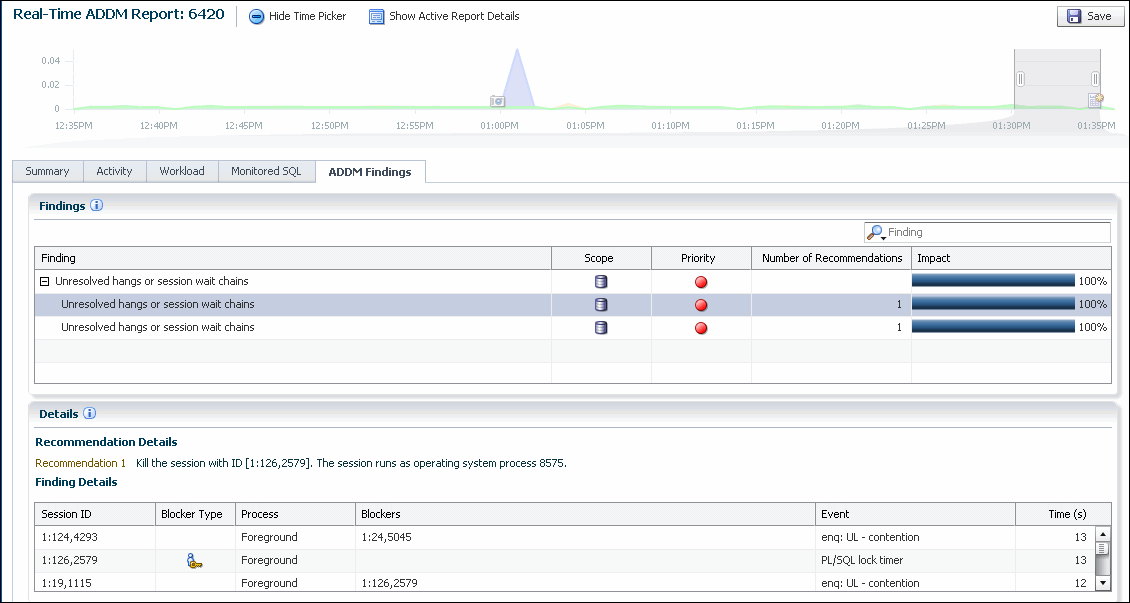
10.2.3 Viewing a Summary of Real-Time ADDM Findings
Real-Time ADDM results consist of a description of each finding and recommended actions for some findings at the point in time when the Real-Time ADDM report was generated. You can view a summary of findings and their impacts on the system.
To view a summary of Real-Time ADDM performance findings:
10.3 Using Advisors to Optimize Database Performance
10.3.1 About Advisors
Advisors are provided to help you improve database performance. These advisors include Automatic Database Diagnostic Monitor (ADDM), SQL advisors, and memory advisors. For example, the SGA Advisor graphically displays the impact on performance of changing the size of the System Global Area (SGA).
You can run a performance advisor when faced with the following situations:
-
You want to resolve a problem in a specific area, for example, to determine why a given SQL statement is consuming 50 percent of CPU time and what to do to reduce its resource consumption.You can use the SQL Tuning Advisor.
-
You are planning to add memory to your system. You can use the Memory Advisor to determine the database performance impact of increasing your SGA or PGA (Program Global Area).
You can also invoke some of the advisors from the Performance Hub page, or through recommendations from ADDM.
Table 10-2 describes the performance advisors.
Table 10-2 Performance Advisors
| Advisor | Description |
|---|---|
|
Automatic Database Diagnostics Monitor (ADDM) |
ADDM makes it possible for Oracle Database to diagnose its own performance and determine how any identified problems can be resolved.See "Performance Self-Diagnostics: Automatic Database Diagnostic Monitor" and "Diagnosing Performance Problems Using ADDM." |
|
SQL Tuning Advisor |
The SQL Tuning Advisor analyzes one or more SQL statements and makes recommendations for improving performance. This advisor is run automatically during the maintenance periods, but can also be run manually. See "About the Automatic SQL Tuning Advisor" and "Running the SQL Tuning Advisor." For more information about the maintenance windows (time periods) for your database, see Oracle Database Reference. |
|
Memory Advisors
|
The Memory Advisors provide graphical analyses of total memory target settings, SGA and PGA target settings, or SGA component size settings. You use these analyses to tune database performance and for what-if planning. Depending on the current memory management mode, different memory advisors are available.
See "Optimizing Memory Usage with the Memory Advisors" for more information about memory advisors, and see "Managing Memory" for more information about memory management modes. |
|
Undo Advisor |
The Undo Advisor assists in correctly sizing the undo tablespace. The Undo Advisor can also be used to set the low threshold value of the undo retention period for any Oracle Flashback requirements. See "Computing the Minimum Undo Tablespace Size Using the Undo Advisor." |
|
Optimizer Statistics Advisor |
Optimizer Statistics Advisor is built-in diagnostic software that analyzes the quality of statistics and statistics-related tasks. The advisor task runs automatically in the maintenance window, but you can also run it on demand. You can then view the advisor report. If the advisor makes recommendations, then in some cases you can run system-generated scripts to implement them. See Oracle Database SQL Tuning Guidefor information about using the Optimizer Statistics Advisor |
10.3.2 About the SQL Tuning Advisor
You use the SQL Tuning Advisor to tune a single SQL statement or multiple SQL statements. Typically, you run the SQL Tuning Advisor in response to an ADDM performance finding that recommends its use. You can also run it periodically on the most resource-intensive SQL statements, and on a SQL workload.
When tuning multiple SQL statements, the SQL Tuning Advisor does not recognize interdependencies between the SQL statements. It solves SQL performance problems by identifying problems with individual SQL statements, such as a poorly performing optimizer plan or the mistaken use of certain SQL structures.
You can run the SQL Tuning Advisor against the following sources:
-
Activity—The most resource-intensive SQL statements executed during the last hour that appear on the Activity tab of the Performance Hub that might have caused recent performance problems.
-
Historical SQL—A SQL statement from the last day, week, or month that appears on the Activity tab of the Performance Hub when one of the historical settings is selected in the Select Time Period field. Use this option for proactive tuning of SQL statements.
-
Historical SQL from ADDM—A resource-intensive SQL statement from an ADDM task that you discover when analyzing a task on the ADDM tab of the Performance Hub.
-
SQL statement in SQL Tuning Advisor—A resource-intensive SQL statement that appears as a tuning task in SQL Tuning Advisor.
-
SQL tuning sets (STS)—A set of SQL statements you provide. An STS can be created from SQL statements captured by AWR snapshots or from a SQL workload.
Note:
You cannot create an STS using EM Express. See Oracle Database SQL Tuning Guide for information on creating an STS.
See Also:
-
Oracle Database 2 Day + Performance Tuning Guide for more information about tuning SQL statements with the SQL Tuning Advisor
10.3.3 About the Automatic SQL Tuning Advisor
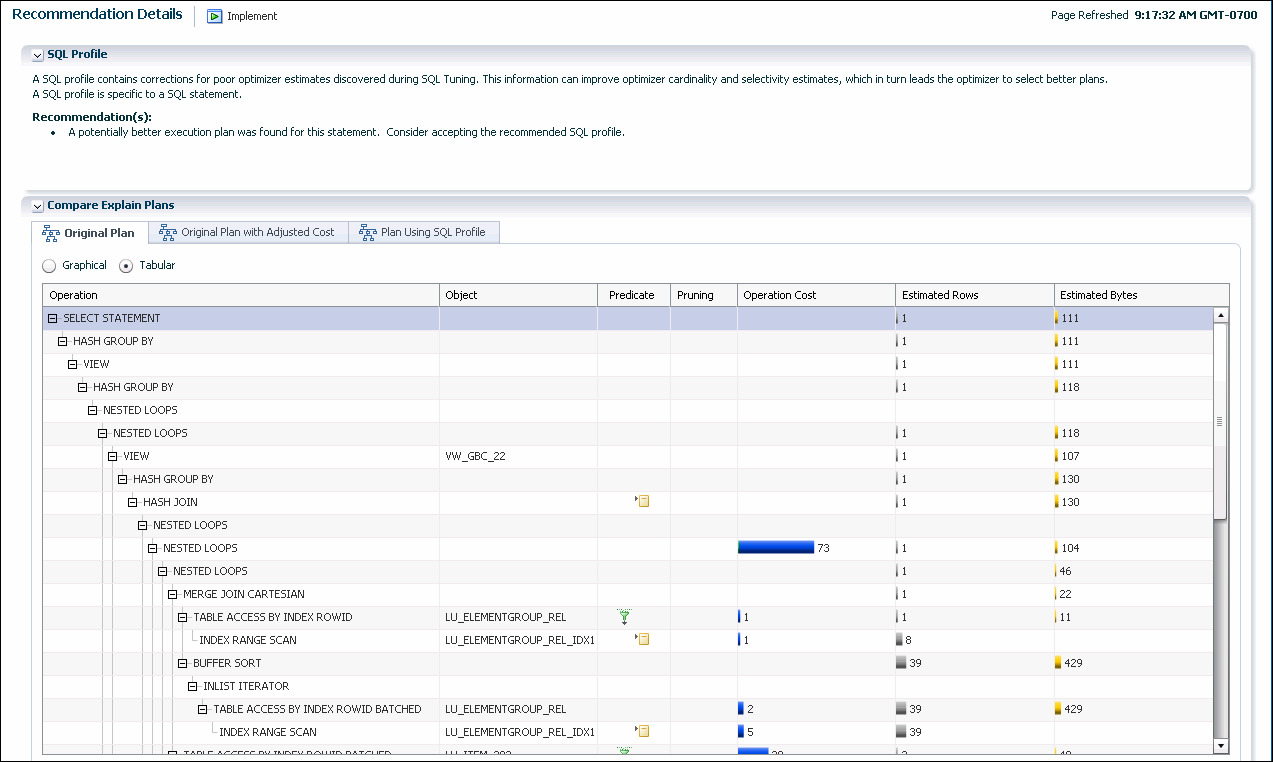
The Automatic SQL Tuning Advisor can be configured to automatically implement SQL profile recommendations. A SQL profile contains additional SQL statistics that are specific to the SQL statement and enable the query optimizer to generate a significantly better execution plan at run time. If you enable automatic implementation, then the advisor creates SQL profiles for only those SQL statements where the performance improvement would be at least threefold. Other types of recommendations, such as the creation of new indexes, refreshing optimizer statistics, or restructuring SQL, can only be implemented manually. DML statements are not considered for tuning by the Automatic SQL Tuning Advisor.
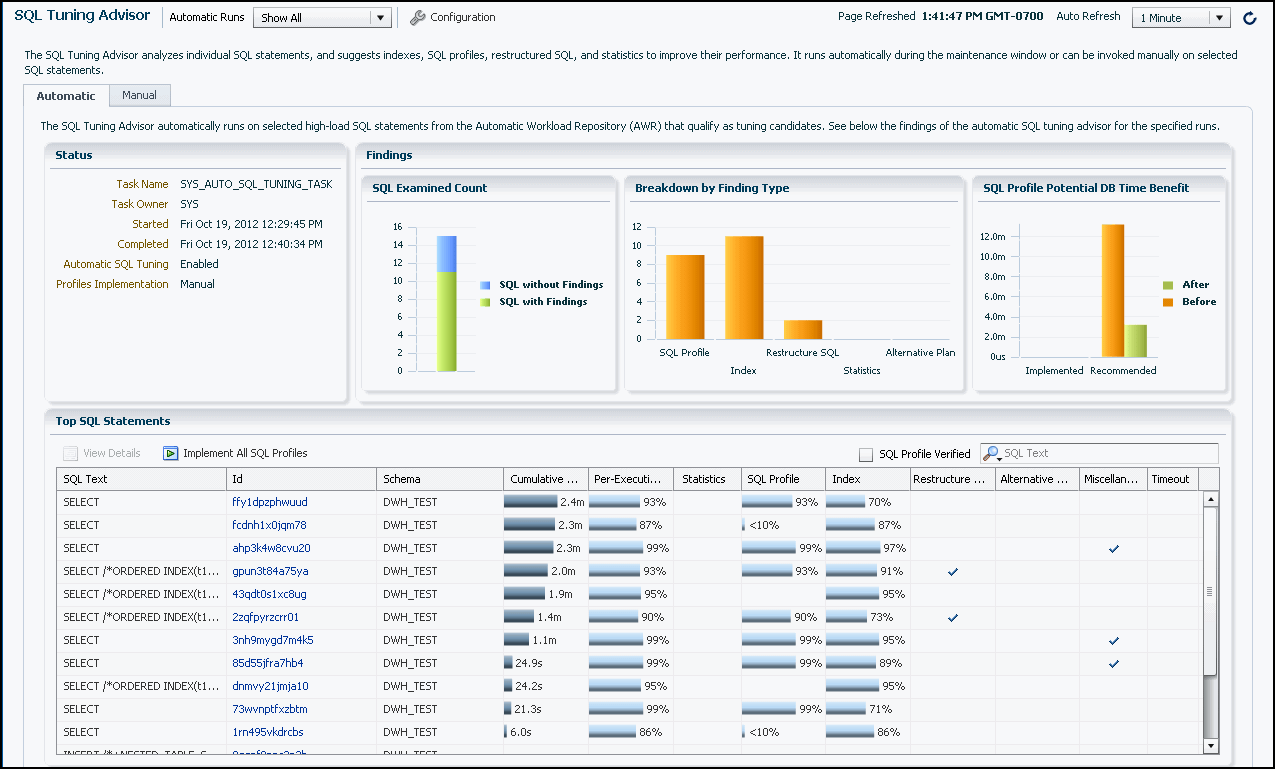
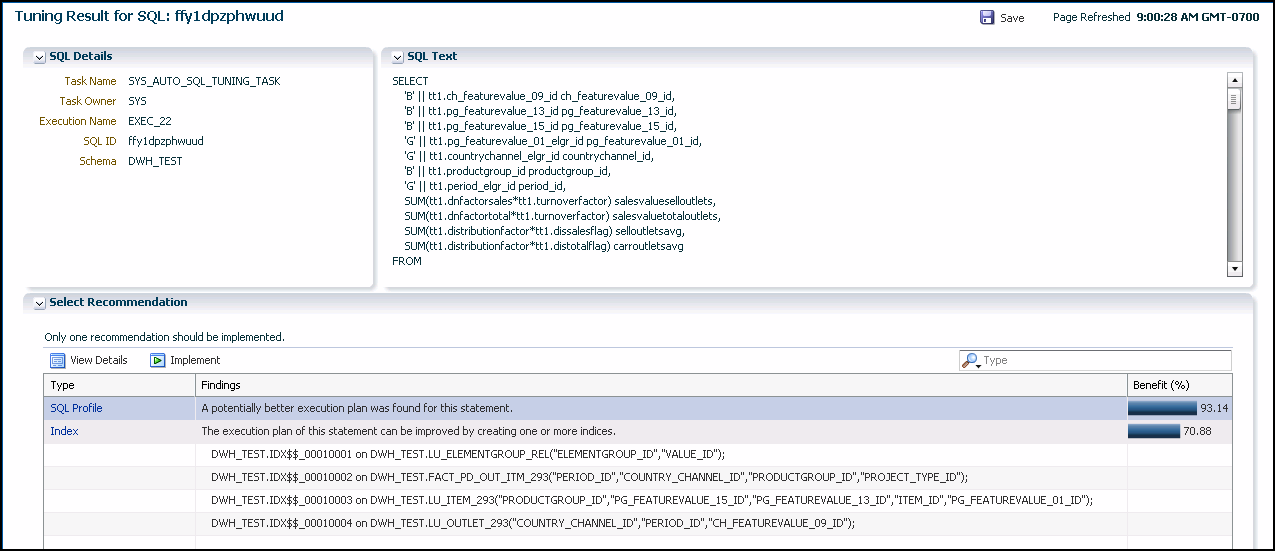
You can view a summary of the results of automatic SQL tuning, and a detailed report about recommendations made for all SQL statements that the SQL Tuning Advisor has processed. You can then implement selected recommendations. You can also view the recommendations that were automatically implemented.
You can disable the Automatic SQL Tuning Advisor, if desired.
See Also:
-
Oracle Database Administrator’s Guide for more information about automated maintenance tasks
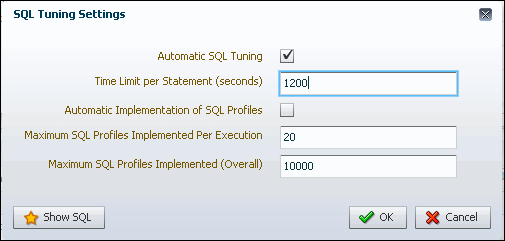
10.3.4 Configuring the Automatic SQL Tuning Advisor
The following are some configuration tasks that you might want to perform for the Automatic SQL Tuning Advisor:
-
Enable automatic implementation of SQL profile recommendations.
Automatic implementation is disabled by default.
-
Change the maximum number of SQL profiles implemented during one run of the SQL Tuning Advisor
When automatic implementation of SQL profile recommendations is enabled, 20 SQL profiles are implemented during a run of the SQL Tuning Advisor, by default.
-
Change the maximum number of SQL profiles that can be implemented overall.
When automatic implementation of SQL profile recommendations is enabled, a total of 10000 SQL profiles can be implemented by SQL Tuning Advisor, by default.
To configure the Automatic SQL Tuning Advisor:
See Also:
"About the Automatic SQL Tuning Advisor" for more information about SQL profiles
10.3.5 Viewing Automatic SQL Tuning Results
You can track the activities of the Automatic SQL Tuning Advisor with EM Express.
To view automatic SQL tuning results:
10.3.6 Running the SQL Tuning Advisor
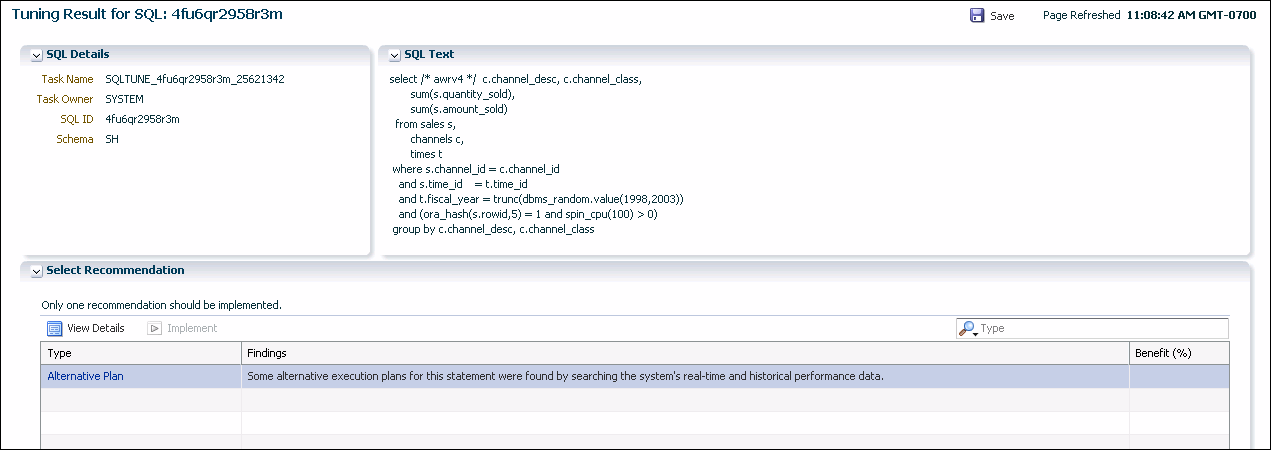
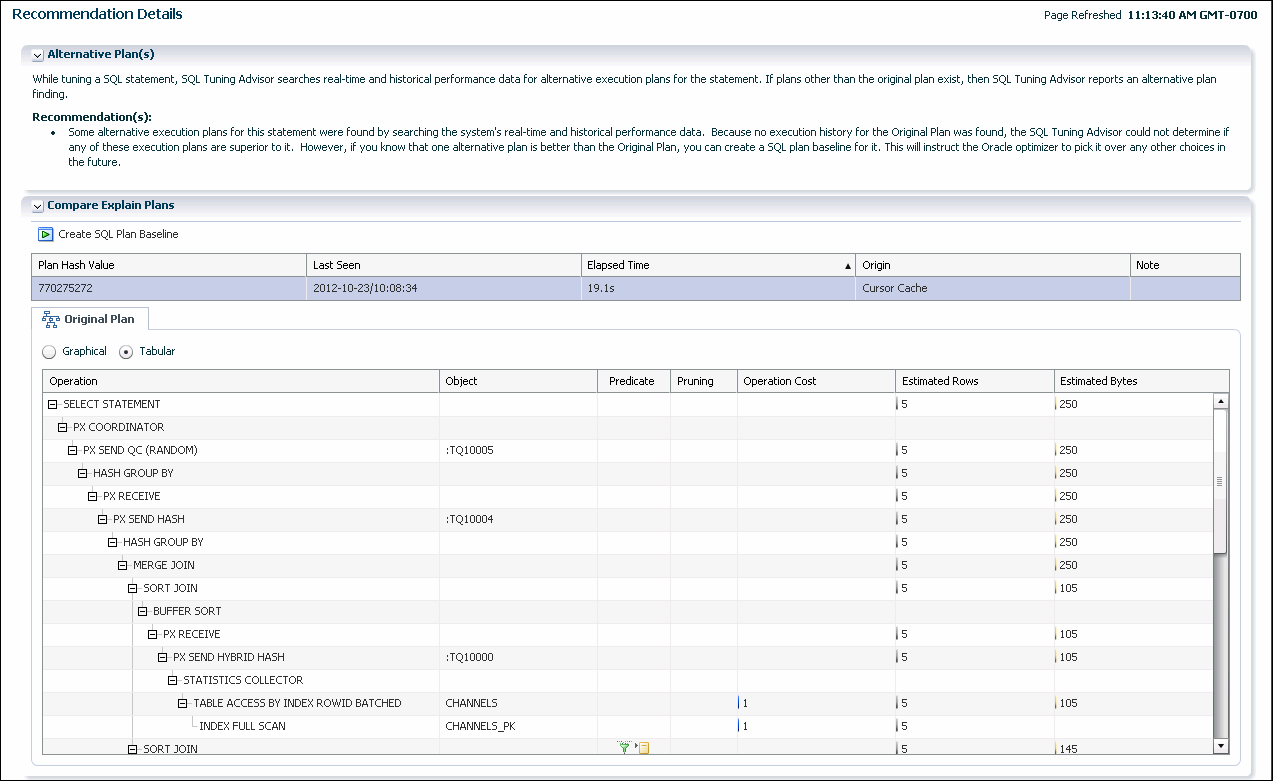
As described in "About the SQL Tuning Advisor," the SQL Tuning Advisor can select SQL statements to tune from several sources. The following scenario assumes that you want to tune the SQL statements with the most activity:
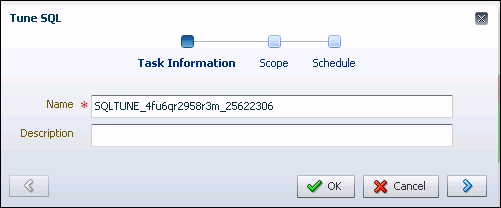
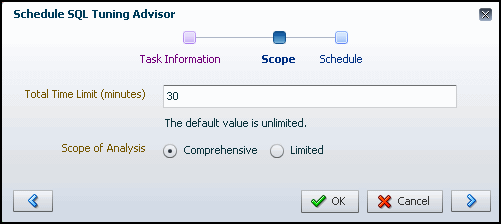
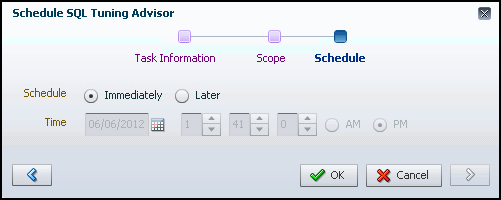
To run the SQL Tuning Advisor:
10.3.7 About Tuning SQL Statements on a Standby Database
In an Oracle Active Data Guard environment, read/write queries can be executed on the primary database, while read-only SQL queries are executed on a standby database. You can use SQL Tuning Advisor in EM Express to tune expensive read-only SQL queries on a standby database.
When tuning Oracle Active Data Guard workloads using SQL Tuning Advisor, the entire SQL tuning process is executed locally at the standby while maintaining the read-only nature of the standby database. This is accomplished by using a database link from the standby to the primary to write any database state changes (such as SQL profile implementation) over to the primary. Recommendations that are implemented on the primary get applied to the standby by Oracle Data Guard redo apply.
Note:
You must have a license for the Oracle Active Data Guard option to be able to tune SQL statements on a standby database.
See Also:
-
"About Viewing Performance Statistics on a Standby Database"
-
Oracle Database SQL Tuning Guide for an introduction to tuning SQL on a remote database, including an example of creating the database link on the standby database to the primary database
10.3.7.1 Tuning SQL Statements on a Standby Database
You can use the SQL Tuning Advisor in EM Express to tune SQL statements for a standby database in an Oracle Active Data Guard environment.
Note:
You must have a license for the Oracle Active Data Guard option to be able to tune SQL statements on a standby database.
This topic assumes that you are familiar with the SQL Tuning Advisor instructions in the "Running the SQL Tuning Advisor" topic.
To run the SQL Tuning Advisor to tune SQL statements for a standby database in an Oracle Active Data Guard environment:
10.3.8 Optimizing Memory Usage with the Memory Advisors
This section includes information about memory advisors.
See Also:
10.3.8.1 About the Memory Advisors
ADDM periodically evaluates the performance of your database to determine performance problems. If ADDM finds that the current amount of available memory is inadequate and adversely affecting performance, then it can recommend that you increase memory allocations. You can select new memory allocations using the Memory Advisors.
Additionally, you can use the Memory Advisors to perform what-if analysis on the following:
-
The database performance benefits of adding physical memory to your database
-
The database performance impact of reducing the physical memory available to your database
With the Memory Advisors, you can obtain memory sizing advice as follows:
-
If automatic memory management is enabled, you can get a prediction of the percentage of time saved by using a different target memory size setting for the Oracle instance.
See "Modifying Memory Settings – Automatic Memory Management" for more information.
-
If automatic memory management is disabled and automatic shared memory management is enabled, you can get a prediction of the percentage of time saved by using a different total SGA size.
See "Modifying Memory Settings – Automatic Shared Memory Management" for more information.
-
If only manual shared memory management is enabled, then you can get a prediction of the percentage of reads saved by using a different database cache size.
See "Modifying Memory Settings - Manual Shared Memory Management" for more information.
10.4 Monitoring and Tuning the Database: Oracle by Example Series
Oracle By Example (OBE) has a series on the Oracle Database 2 Day DBA guide. This OBE series steps you through the tasks in this section, and includes annotated screenshots.
-
Generate some Database Activity
-
Monitor Database Performance Using Enterprise Manager Database Express
-
To see a clickable list of the above tutorials, go to Monitor and Tune the Database Series.
-
For seamless navigation through the tutorial series, access the following link:
You can navigate across the tutorials by clicking the > button at the bottom of the pane.
